Jammu and Kashmir: Hindus no more have a place in the Valley
With this post, we begin discussing those States and regions where the Muslims or Christians have a significant and growing presence. As we have said earlier, for the purpose of this analysis, we divide the population into three groups, Muslims, Christians, and the rest, who we refer to as Indian Religionists (IR), though these may include a smattering of Jews, Parsis and atheists, etc. We discuss the communities included within the IR separately only when there are some significant facts to be underlined.
We begin this analysis from the northern-most State of India, Jammu and Kashmir. The State includes three distinct regions: Jammu, Kashmir Valley and Ladakh. Indian Religionists form a large majority in the Jammu and Ladakh regions; in the former, they are mainly Hindus and Sikhs, in the latter, the IR are mainly Buddhists. The Kashmir Valley region is now almost exclusively Muslim. The IR do constitute 3.4 percent of the population of the Valley in 2011, but nearly all of them are adult males with only a few women or children among them. There are not many IR families in the Valley. Until 1981, there used to be 6 to 7 percent Indian Religionists in the Valley; and they are known to have been integral part of the Kashmiri society. After 1981, they have been excluded from this northern-most part of the country. This must count as a historic and cataclysmic change in the religious demography of India. Incidentally, after 1981, the share of IR in the Jammu region has also begun to decline.
We begin this analysis from the northern-most State of India, Jammu and Kashmir. The State includes three distinct regions: Jammu, Kashmir Valley and Ladakh. Indian Religionists form a large majority in the Jammu and Ladakh regions; in the former, they are mainly Hindus and Sikhs, in the latter, the IR are mainly Buddhists. The Kashmir Valley region is now almost exclusively Muslim. The IR do constitute 3.4 percent of the population of the Valley in 2011, but nearly all of them are adult males with only a few women or children among them. There are not many IR families in the Valley. Until 1981, there used to be 6 to 7 percent Indian Religionists in the Valley; and they are known to have been integral part of the Kashmiri society. After 1981, they have been excluded from this northern-most part of the country. This must count as a historic and cataclysmic change in the religious demography of India. Incidentally, after 1981, the share of IR in the Jammu region has also begun to decline.
| Religious Demography of Jammu and Kashmir, 1901-2011 | ||||||||
1901
|
1951
|
1961 | 1971 | 1981 | 1991 | 2001 | 2011 | |
| Population | 21,39,362 |
32,53,852
|
35,60,976
|
46,16,632
|
59,87,389
|
78,37,051
|
1,01,43,700
|
1,25,41,302
|
| %GR |
–
|
–
|
9.44 | 29.65 | 29.69 | 30.89 | 29.43 | 23.64 |
| Indian R |
6,24,662
|
9,62,201
|
11,26,061
|
15,69,321
|
21,35,457
|
26,84,024
|
33,30,161
|
39,38,186
|
| %IR |
29.20
|
29.57 | 31.62 | 33.99 | 35.67 | 34.25 | 32.83 | 31.40 |
| Muslims |
15,13,800
|
22,89,211
|
24,32,067
|
30,40,129
|
38,43,451
|
51,39,635
|
67,93,240
|
85,67,485
|
| %Muslim | 70.76 | 70.35 | 68.30 | 65.85 | 64.19 | 65.58 | 66.97 | 68.31 |
| Christians | 800 | 2,440 | 2,848 | 7,182 | 8,481 | 13,392 | 20,299 | 35,631 |
| %Christian | 0.04 | 0.07 | 0.08 | 0.16 | 0.14 | 0.17 | 0.20 | 0.28 |
In the Table above, we have compiled the religious profile of the population of the State for 1951 to 2011. For the sake of perspective, we have included the data for 1901 also. Incidentally, regular decennial Census could not be conducted in the State in 1951 and 1991. We have taken the total population for these years from the estimates of Census 2011 and the religious distribution for 1951 and 1991 has been worked out by extrapolation between Censuses; religious profile of 1901 has also been calculated by assuming it to be the same as in 1911.
As seen in the Table, the population of
Jammu and Kashmir, like that of the rest of India, has flourished since
Independence. In the 50 years between 1901 and 1951, the total number of people
in the State multiplied by one and a half time, in the sixty years since then,
the population has multiplied by nearly 6 times. The growth rate of the
population remained near 30 percent per decade from 1961 to 2001, and has
moderated to around 24 percent only in the last decade of 2001-11.
The other remarkable feature of the
data compiled in the Table above is that up to 1981, the share of Indian
Religionists in the population was consistently rising; it went up from 29.6
percent in 1951 to 35.7 percent in 1981. In the three decades since then,
however, it has declined by more than 4 percentage points to 31.4 percent. The
proportion of Muslims has correspondingly risen from 64.2 to 68.3 percent. The
number of Christians in the State has multiplied by nearly 15 times since 1951;
but their share in the population remains fairly low at less than 0.3 percent.
Three
Regions of Jammu and Kashmir
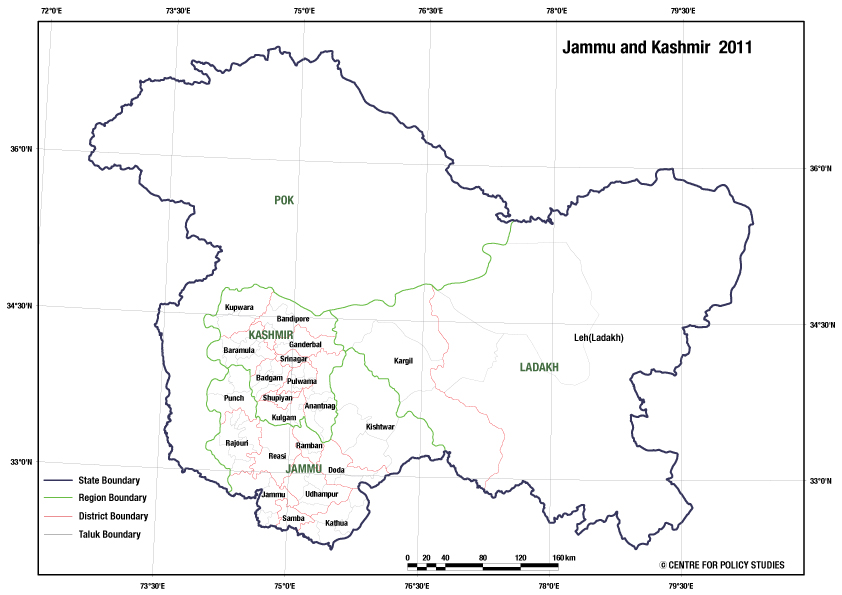
The State comprises three geographically
distinct regions: Jammu, Kashmir Valley and Ladakh. Below, we have compiled the
population data for these regions separately. Besides these three, there is a vast
region under the adverse occupation of Pakistan and China; the population of
this region is not included in the total of the State. Map of the State, given in
the Appendix, shows these three regions and the districts included in them.
| Religious Demography of the three Regions of Jammu and Kashmir, 1951-2011 | |||||||
| 1951 | 1961 | 1971 | 1981 | 1991 | 2001 | 2011 | |
| Kashmir Valley | |||||||
| Population |
17,12,964
|
18,99,438
|
24,35,701
|
31,34,904 |
41,68,608
|
54,76,970
|
68,88,475
|
| %GR |
12.22
|
10.89
|
28.23
|
28.71
|
32.97 |
31.39
|
25.77
|
| Indian R |
1,05,834
|
1,45,426
|
1,57,506
|
1,51,613
|
2,35,661
|
||
| %IR |
5.57
|
5.97
|
5.02
|
2.77
|
3.42
|
||
| Muslims |
17,93,300
|
22,89,530
|
29,76,932
|
53,21,600
|
66,40,957
|
||
| %Muslim |
94.41
|
94.00
|
94.96 | 97.16 | 96.41 | ||
| Christians | 304 | 745 | 466 | 3,757 | 11,857 | ||
| %Christian | 0.02 | 0.03 | 0.01 | 0.07 | 0.17 | ||
| Jammu | |||||||
| Population |
14,58,548
|
15,72,887
|
20,75,640
|
27,18,113 |
34,89,033
|
44,30,191
|
53,78,538
|
| %GR | 8.51 | 7.84 | 31.96 | 30.95 | 28.36 | 26.97 | 21.41 |
| Indian R |
9,71,861
|
13,67,816
|
19,05,698
|
30,54,537
|
35,56,794 | ||
| %IR | 61.79 | 65.90 | 70.11 | 68.95 | 66.13 | ||
| Muslims |
5,98,492
|
7,01,468
|
8,04,637
|
13,59,521
|
17,99,232
|
||
| %M | 38.05 | 33.80 | 29.60 | 30.69 | 33.45 | ||
| Christians |
2,534
|
6,356
|
7,778
|
16,133
|
22,512
|
||
| %C | 0.16 | 0.31 | 0.29 | 0.36 | 0.42 | ||
| Ladakh | |||||||
| Population |
82,340
|
88,651
|
1,05,291
|
1,34,372
|
1,79,410
|
2,36,539
|
2,74,289
|
| %GR |
8.30
|
||||||
| Indian R |
48,368
|
56,079
|
72,253
|
1,24,011
|
1,45,731
|
||
| %IR | |||||||
| Muslims |
40,274
|
49,131
|
61,882
|
1,12,119
|
1,27,296
|
||
| %M | |||||||
| Christians | 9 | 81 | 237 | 409 | 1,262 | ||
| %C | 0.01 | 0.08 | 0.18 | 0.17 |
0.46
|
||
Valley is the most densely populated
Of
the three regions of the State, Kashmir Valley is the smallest in area, but has
the largest population. Area of the Valley is 15,948 km2 compared to
26,293 km2 of the Jammu and 59,146 km2 of the Ladakh
region. Density of population in the Valley is high at 432 persons per km2;
in Jammu, it is less than half of the Valley at 205 persons per km2;
Ladakh accommodates only 46 persons per km2. Incidentally, an area
of 1.21-lakh km2 is under adverse occupation; of this, 78 thousand
km2 is controlled by Pakistan and about 43 thousand km2
is controlled by China.
Valley is growing the fastest
As
seen in the Table above, the population of the Valley has been growing faster
than that of the Jammu region since 1981. During 1961-1981, it was the Jammu
region that grew the fastest. During the last decade of 2001-11, Jammu has
grown by 21.4 percent, while the population of the Valley has increased by 25.8
percent. The gap is even larger than the previous decade when the population of
the Valley expanded by 31.4 percent, while that of the Jammu region grew by
less than 27 percent.
This
higher rate of growth of the population of the Valley during the last 3 decades
is a sore point among the people of Jammu, where there is a widespread feeling
that their population is being deliberately undercounted.
Ladakh
has grown slower than the other two regions, except during 1981-2001. The
growth rate of the region has fallen particularly sharply during the last
decade of 2001-11, when the population of Ladakh has grown by merely 16 percent
compared to the growth of 31.8 percent in the previous decade. This is in
consonance with the lower growth of Buddhists—who form a majority in the
population of Ladakh—in the country as a whole.
Muslim share has been rising in the
Jammu region since 1981
The
religious profile of the three regions is quite different, which we discuss in
some detail later. Here we only remark that the proportion of Muslims in the Jammu
region has risen quite sharply during the last decade, from 30.7% in 2001 to 33.5%
in 2011. They recorded a much smaller rise of about 1-percentage point in the
two decades between 1981 and 2001. Before 1981, however, the proportion of
Muslims in this region was declining; it had declined sharply from 38.1 percent
in 1961 to 29.6 percent in 1981 and the share of IR had correspondingly risen
from 61.8 to 70.1 percent.
Muslim share in the Valley rose sharply
between 1981 and 2001
The
share of Indian Religionists in the population of the Valley had been more or
less stable between 5 to 6 percent up to 1981. Between 1981 and 2001, the share
of IR in the valley declined drastically to 2.77 percent. There has been a
slight improvement during 2001-11. But, as we see later, the population of
IR—especially that of the Hindus—in the Valley comprises mainly adult males;
and, thus, does not form a part of the society there.
Muslim and IR share in Ladakh has
remained unchanged
Share
of IR and Muslims in the population of Ladakh has remained largely unchanged.
But, within the IR, the proportion of Buddhists has declined. We shall discuss
changes in the religious profile of Ladakh region in detail later in this note.
1981 marks a turning point in the
religious demography of the State
Thus
the year 1981 seems to mark a turning point in the religious demography of
Jammu and Kashmir. Before 1981, Jammu was growing faster than the Valley; after
1981, the pattern reversed. Before 1981, the share of Muslims in the Jammu
region was declining; after 1981, it began to rise sharply. Before 1981, the IR
had a significant presence in the Valley; after 1981, their share in the
population suddenly declined, and they seem to have been entirely excluded from
the society there.
Religious Profile of the Valley: Hindus and Sikhs
Hindus have grown faster than Muslims
during 2001-11
Religious Profile of Kashmir Valley
|
|||
2001
|
2011
|
%GR
|
|
Total
|
54,76,970
|
68,88,475
|
25.77
|
Hindu
|
1,00,962
|
1,68,833
|
67.22
|
Muslim
|
53,21,600
|
66,40,957
|
24.79
|
Christian
|
3,757
|
11,857
|
215.60
|
Sikhs
|
48,219
|
55,950
|
16.03
|
Buddhist
|
1,722
|
730
|
-57.61
|
Jain
|
501
|
212
|
-57.68
|
ORP
|
16
|
70
|
337.50
|
RNS
|
193
|
9,866
|
5011.92
|
Of
68.9 lakh persons counted in the Valley in 2011, 66.4 lakh are Muslims. There
are 2.36 lakh Indian Religionists; of them 1.69 lakh are Hindus and 56 thousand
Sikhs. Among the other communities, only Christians and those counted under
Religion Not Stated (RNS) have any significant numbers; both these groups have
multiplied several times during 2001-11. The growth of Hindus in this decade
has also been higher than the average; it is reflected in the rise of their
share from 1.84 to 2.45 percent. The share of Sikhs, on the other hand has
declined from 0.88 to 0.81 percent.
But Hindus in the State hardly form a settled population
Hindus of Kashmir Valley
|
|
Total
|
1,68,833
|
Females
|
15,764
|
Children 0-6 yr
|
4,986
|
Literate Persons
|
1,56,955
|
Total Workers
|
1,48,262
|
Main Workers
|
1,43,859
|
Fortunately,
the Census of 2011 has released age-distribution data for different communities
disaggregated up to the district level. An analysis of this data shows that
Hindus in the Kashmir Valley are mainly adult males. In their population of
1.68 lakh persons, there are only 15.8 thousand women and less than 5 thousand
children, forming 9.34 and 2.95 percent of the population, respectively. The
data also shows that in the total Hindu population of 1.68 lakh, 1.48 lakh are
workers; of them 1.44 lakh fall in the main worker category. There are hardly
any illiterate persons among the Hindus; the number of literates in the
population is 1.57 lakhs, leaving only about 11 thousand illiterates. The
Hindus of Jammu and Kashmir thus comprise mainly adult, male, literate, working
persons, who are in the State for work or business and not many of whom are
raising their families in the State. Such a population can hardly be part of
the local society.

The peculiar age and gender structure of the Hindu population in Kashmir valley is starkly visible in the age pyramid of this population given above. The population lies almost entirely in the adult years; 88 percent of Hindus are in the prime working age group of 20-49 years. And, the pyramid is greatly skewed towards the right; 90.7 percent of the population comprises males. This pyramid is a visual representation of the fact that Hindus in Kashmir Valley no more constitute an established normally growing population. The Valley, it seems, has indeed been cleansed of the Hindus.
Sikhs in the Valley have faired
somewhat better
Sikhs of Kashmir Valley
|
|
Total
|
55,950
|
Females
|
21,325
|
Children 0-6 yr
|
4,537
|
Literate Persons
|
46,797
|
Total Workers
|
26,833
|
Main Workers
|
22,874
|
Sikhs in the Valley seem to still
retain some families there and remain a part of the local society. In about 56
thousand Sikhs in the Valley, there are 21.3 thousand women and 4.5 thousand
children. The gender ratio still turns out to be highly skewed with 616 women
per 1,000 men. The number of children at 8.1 per hundred is also rather low.
But these numbers, unlike those for the Hindus, indicate a somewhat settled
population. The age-pyramid of the Sikh population also seems somewhat more
balanced than that of Hindus; though it is highly skewed towards the left and towards
the working age cohorts. The proportion of Sikhs in the Valley, however, has
been declining. In 1981, their share in the population was somewhat more than 1
percent; it declined to 0.88 percent in 2001 and has further declined to 0.80
percent in 2011.


Distribution of Hindus and Sikhs in the
Valley
Both
Hindus and Sikhs have a relatively larger share in Srinagar, Baramula and
Pulwama districts. The share of Sikhs in these three districts is around or
above 1 percent; Hindus in these comprise about or more than 2.5 percent of the
population. Hindu share is above 2 percent also in Bandipore, which has been
carved out of Baramula during 2001-11. (See, Map of the distribution of Sikhs
in the State given in the Appendix).
Religious Profile of Ladakh
Buddhists dominate Leh, Muslims
dominate Kargil
Religious Profile of Leh (Ladakh)
|
|||
2001
|
2011
|
%GR
|
|
Total
|
1,17,232
|
1,33,487
|
13.87
|
Hindu
|
9,573
|
22,882
|
139.03
|
Muslim
|
16,156
|
19,057
|
17.96
|
Christian
|
338
|
658
|
94.67
|
Sikhs
|
503
|
1,092
|
117.10
|
Buddhist
|
90,618
|
88,635
|
-2.19
|
Jain
|
2
|
103
|
5050.00
|
ORP
|
7
|
54
|
671.43
|
RNS
|
35
|
1,006
|
2774.29
|
Religious Profile of Kargil
|
|||
Total
|
1,19,307
|
1,40,802
|
18.02
|
Hindu
|
5,142
|
10,341
|
101.11
|
Muslim
|
95,963
|
1,08,239
|
12.79
|
Christian
|
71
|
604
|
750.70
|
Sikhs
|
227
|
1,171
|
415.86
|
Buddhist
|
17,875
|
20,126
|
12.59
|
Jain
|
1
|
28
|
2700.00
|
ORP
|
6
|
4
|
-33.33
|
RNS
|
22
|
289
|
1213.64
|
Ladakh
is divided into two districts, Leh and Kargil. Religious profile of these is
quite different; Buddhists form 66.4 percent of the population of the former,
and there are 14.3% Muslims there; in the latter, there are 14.3% Buddhists and
76.9% Muslims.
Growth of Buddhists has been low
The
most striking feature of the religious profile of Ladakh is that the Buddhists
have recorded negative growth in Leh; and, their growth has been lower than the
average in Kargil also. In Leh, their number has declined from 90.6 to 88.6
thousand; in Kargil, they have grown from about 17.9 to 20.1 thousand. Thus,
the total number of Buddhists in Ladakh has risen by about 300 persons. The
number of Buddhists in the rest of the State has declined from 5.3 to 3.8
thousand. Buddhists in the State as a whole have recorded negative growth;
their population has declined from 1,13,787 in 2001 to 1,12,584 in 2011. Though
Buddhists in India have grown rather slowly during 2001-11, this is the only State
with a significant presence of traditionally Buddhist communities to have
recorded negative growth; the other States, where the number of Buddhists has
declined, are generally those with the more recent neo-Buddhist communities.
Share of Hindus and Sikhs has risen but
they are not settled communities in Ladakh
During 2001-11, the number of Hindus
and Sikhs has grown considerably in both Leh and Kargil. In Ladakh as a whole,
the proportion of Hindus has risen from 6.2 percent in 2001 to 12.1 percent in
2011; and, the share of Sikhs has increased from 0.31 to 0.83 percent. But as
in the Kashmir Valley, Hindus, and also Sikhs, in Ladakh are predominantly
adult males. Among 2,263 Sikhs in Ladakh, there are only 144 women and 10
children. Among 33,223 Hindus, there are 1,280 women and 213 children of 0-6
years age. The highly skewed age and gender structure of the Hindus can be seen
in their age pyramid here. We are not giving the age pyramid of Sikhs because
their total number is rather small.

For
the sake of comparison we are giving below the age-pyramids of Buddhists and
Muslims in Ladakh. The pyramid for the Buddhists is considerably narrower;
however, the 0-4 cohorts of the Muslims also seem to have begun shrinking.
Buddhists also have a higher gender ratio as compared to Muslims.


Religious Profile of Jammu
Religious Profile of Jammu
|
|||
2001
|
2011
|
%GR
|
|
Total
|
44,30,191
|
53,78,538
|
21.4
|
Hindu
|
28,89,672
|
33,64,618
|
16.4
|
Muslim
|
13,59,521
|
17,99,232
|
32.3
|
Christian
|
16,133
|
22,512
|
39.5
|
Sikhs
|
1,58,205
|
1,76,635
|
11.6
|
Buddhist
|
3,572
|
3,093
|
-13.4
|
Jain
|
2,014
|
2,147
|
6.6
|
ORP
|
68
|
1,380
|
1929
|
RNS
|
1,006
|
8,921
|
787
|
Sikhs in the Jammu region
Among
35.6 lakh Indian Religionists in the Jammu region, there are 33.6 lakh Hindus
and 1.8 lakh Sikhs; there are only a few Buddhists, Jains and others.
Sikhs—they
constitute a considerable 3.3% of the population of the region—are concentrated
almost entirely in Jammu and Samba districts. Of the total 1.8 lakh Sikhs, 1.3
lakh are in these two districts, where they form 7.5 and 5.6 percent of the
population, respectively. Samba district has been carved out of Jammu only in
2001-11. Of the remaining Sikhs in the region, 26.7 thousand are in Punch and
Rajauri; they have a share of around 2.4% in the population of these two
districts. There are only a few Sikhs in other districts of the Jammu region.
(See, Map of the distribution of Sikhs in the Appendix).
As
elsewhere, the growth of Sikhs in Jammu during 2001-11 has been much slower
than both the Hindus and Muslims.
Growth in the share of Muslims
Muslims
form a considerable and growing part of the population of Jammu. As we have
seen, they have a share of 33.5 percent in 2011; their share was 30.7 percent
in 2001. During 2001-11, Muslims in the region have grown by 32.3 percent
compared to the Hindu growth of 16.4 percent. The difference in the population
dynamics of Hindus and Muslims is clearly visible in the age-pyramids of the
two communities below.


From
these age-pyramids, it is clear that the Muslims shall continue to grow
considerably faster than the Hindus for several decades. The difference between
the number of children of 0-6 year in the communities is rather large; there
are 19.2 children per hundred of the Muslim population compared to 12.6 per
hundred for the Hindus. Female literacy rate for the Muslims is 45.2 percent
compared to 68.8 percent for the Hindus. Gender ratio for Muslims is 929
compared to 867 for Hindus. The difference in the gender ratios for the two
communities is even higher for the actively reproductive age group of 20-39
years; in this group, the gender ratio for Muslims is 989 and for Hindus it is 864.
All these factors are likely to contribute to continuing higher growth of
Muslims.
Distribution of Muslims in the Jammu
region
District
|
Total
|
Muslims
|
%M
|
Punch
|
4,76,835
|
4,31,279
|
90.45
|
Rajouri
|
6,42,415
|
4,02,879
|
62.71
|
Reasi
|
3,14,667
|
1,56,275
|
49.66
|
Ramban
|
2,83,713
|
2,00,516
|
70.68
|
Kishtwar
|
2,30,696
|
1,33,225
|
57.75
|
Doda
|
4,09,936
|
2,20,614
|
53.82
|
Udhampur
|
5,54,985
|
59,771
|
10.77
|
Kathua
|
6,16,435
|
64,234
|
10.42
|
Samba
|
3,18,898
|
22,950
|
7.20
|
Jammu
|
15,29,958
|
1,07,489
|
7.03
|
As
seen in the Map of the distribution of Muslims in the Appendix, and in the
Table here, Muslims have a considerable presence in the northern parts of Jammu
region. They form 90.5% of the population in Punch, 70.7% in Ramban and 62.7%
in Rajouri. Muslim share is above 50% in Doda and Kishtwar. In Reasi, their share is near 50%; but, in
the northern Gool-Gulabgarh taluk of this district, their presence is much
higher at 79.3 percent. Hindus have a dominating share only in the southern
Udhampur, Kathua, Jammu and Samba districts and in the some of the southern
taluks of the northern districts.
Presence
of Hindus and Sikhs is thus restricted to only to this small southeastern
pocket of the State. (See, Maps in the Appendix). They hardly have a settled
place in the Kashmir Valley or Ladakh, and they are in a minority in the
northern parts of Jammu.
Summing up
1.
The population of Jammu and Kashmir, like that of the rest of the India, has
been flourishing since Independence. Between 1901 and 1951, the population of
the State had multiplied by barely one and a half time; since 1951, it has
multiplied six-fold.
2.
Population of Kashmir Valley has increased more rapidly than the other two
regions of the State. Between 1951 and 2001, population of the Valley has
multiplied by 4.0, that of the Jammu region by 3.7 and of Ladakh by 3.3. The
gap between the growth of the Valley and the other regions has become larger in
recent decades.
3.
Hindus and Sikhs had a small but stable presence in the Valley until 1981.
After 1981, there was a sudden decline in their share in the population.
4.
Though the share of Hindus in the Valley has increased during 2001-11, yet the
Hindus there no more constitute a settled population. The Hindus in the Valley
are largely adult working males, with only few women and children among them.
5.
The Sikh population of the Valley has also been declining since 1981. And they
also have a preponderance of adult males among them, though the phenomenon is
not as stark for them as for the Hindus.
6.
In Ladakh also, Hindus and Sikhs are predominantly adult males, with hardly any
women or children among them.
7.
Buddhists, who dominate Leh district of Ladakh, have been growing rather
slowly. Their age-pyramids indicate a stabilising population.
8.
Muslims have a higher than average rate of growth in all three regions.
9.
Share of Muslims in Jammu was declining up to 1981; after 1981, their share has
begun to rise in this region also.
10.
The age-pyramids of the Jammu region, and other demographic parameters,
indicate that the Muslims there are likely to keep growing faster than the
Hindus for several decades.
11.
The year 1981 seems to mark a turning point in the religious demography of the
State. After that year, Hindus and Sikhs have lost their foothold in the
Valley, and Muslim share has begun to rise in Jammu region also.
12.
Hindus and Sikhs in the State now have a significant presence only in the
southern parts of Jammu region. They are a small minority in the northern part
of Jammu, and their rather small presence in Kashmir Valley and Ladakh
comprises unsettled population of adult males without their families.


Appendix
Maps
showing the districts and regions of Jammu and Kashmir and the distribution of
Sikhs, Muslims, Hindus and Buddhists: